Saturday, 11 February 2017

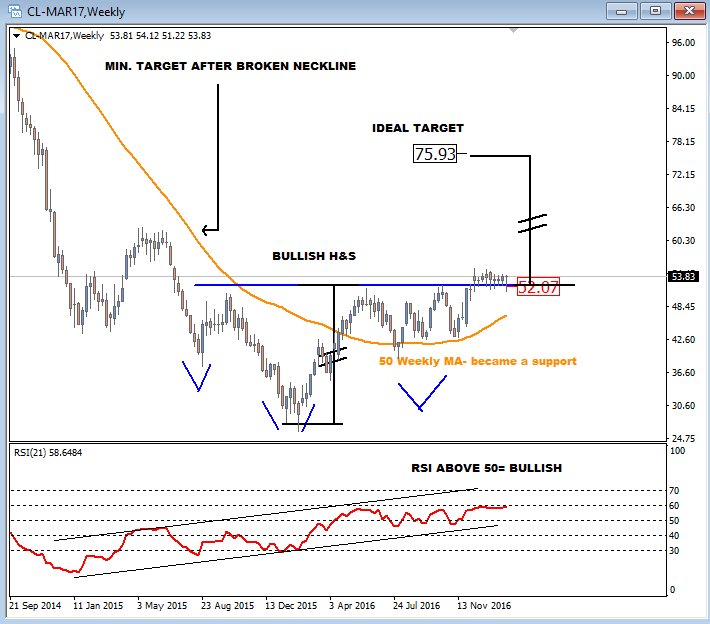
See, what Grega Horvat is saying about crude.


Crude oil is moving sideways for the last few week, a correction that will take us higher i believe. for now, above the neckline

Thursday, 9 February 2017

Short copper below Rs 388

Study the given hourly & daily chart of copper & short copper if it breach the given support lines.


As shown in the hourly chart, there are 2 support lines near 387 & 388 for copper price. If price breach these lines, it can tumble down. Again question arises about target. Many readers confuse about it and ask me by mail. But for tgt, study the geven daily chart and look @ the S3 line which can be next stop for copper. Which is placed @ 372 around. But I know that, you guys are typical intraday type guys, you can watch the given levels, if copper price breach s1 , s2 then go short on it and earn some money. Thank you & Jay shriram.

Update 1 -- 12.48 pm, 11th Feb 2017.

Short copper call is not initiated. Price took U turn & turn upward from389. So call is closed. Yes, this the great aspect of positional trading. If we not get the correct chart structure, we should not trade. We lost nothing. Thank you, Jay Shriram.

Friday, 3 February 2017

safe commodity trades : short crude below 3568

safe commodity trades : short crude below 3568: Short crude if it will breach the level of 3568 & stay there for a while. Read the below given hourly chart very carefully. And only aft...

short crude below 3568

Short crude if it will breach the level of 3568 & stay there for a while. Read the below given hourly chart very carefully. And only after that start reading.
As mentioned in the chart & shown in the prior post, crude is in the no trading zone of 3570 to 3670. If it breach the support line of 3568, then and only then go short. After that, price will go to take suport from channel resistance line. Which will go down & down, as it is southmoving channel.
Thank you.

Update 1, 4th Feb 2017, 01.17 pm. 

CMP is 3615. wait for given price 3568 below to go short on crude. If it will not happen, then wait for few days or hours. That will give us some technical advantage. It is not binding to us to trade on daily basis and loose money. Wait for good chart structure to enter trade. Thank you. 
Update 2, 8th feb 2017, 03.37 pm.
Book complete profit and exit the crude short position. We shorted it @ 3568 and cmp is 3480 around. We have nearly 90 rupees profit in hand.i.e. Rs 9000 in single lot. so hurry up guys. It can not go below 3400. So book your profit. Jay shriram


Thursday, 2 February 2017

Crude - waiting for a good chance to enter short trade

2nd feb 2017, 11.25 am, Yes, I am watching crude movement since last few days and waiting for a good chance to enter a short position. Look @ the chart carefully and only then read.
From 27 th Jan 2017 Crude is in a down move. I draw a channel to show the down move. Price broke the channel resistance line around 1st Feb. Point to be noted that this is hourly chart. After breaking channel upwards and gained Rs 30 & made a high around 3620. Again it dropped but took support of upper channel line. Again this rule is proved that," if price broke resistance line and stay above it for considerable time, the resistance line becomes support line." Here you can see the same is happened. Rs 3640 & 3700 is the resistance but if price break last low of 3560 then it will go to take support from channel line , which is going down & down as the time is passing away. I show this down moving tgt in red arrows. This is not trading call. Just for info.

Monday, 23 January 2017

buy copper

buy copper @ cmp 399 for the tgt of 409, positional call. sl should be 394, wish you best luck.

Update 25 jan 2017 -- Tgt  nearly achived, enjoy profits. thank you. Profit Rs 10000 on single lot. Enjoy.

Thursday, 19 January 2017

Natural Gas

Enter new short position in NG. Positional trade. Expected tgt 190.
Update 1 -- 23 jan 2017, 11.42 am , cmp is 217, wait for the given tgt of 190.
Update 2 -- 31 jan 2017, 03.44 pm , 
After so many up & downs, finally we are in profit. As shown in the chart with blue color arrow, we enter in short position between Rs 228 -- 224. Now we are in new contract & latest price of NG is 216. If we take Rs 224 as shorting price, ( which is lowest price of the day on which we enter the trade ) we have 6 points of profit in our hand. But I suggest you to wait for tgt. Thank you. I am predicting that after breaking 212 on downside, NG will touch our tgt of 190 within few hours. 

update 3 --  see the chart below. NG is @ 213. Our shorting price is between 228 -- 224. we are in more than 10 points profit, that means if we sold a single lot, then we have more than Rs 12,500 in our hand now. I suggest to wait for tgt of Rs 190. After breaching 212 mark NG should tumble down to Rs 190 in no time. 


Update 4 - 3/2/2017,  01.57 pm

See the magic of dow theory. Lower tops & lower highs. If the price go below 2nd low of 210.50 and stay there for a while , then it will tumble down very very fast. I suggest to hold the short position for the prior mentioned tgt of 190. Jay shriram.

Update 5, 8th Feb 2017, 05.02 pm

NG Price should go to touch 202. It has support there, otherwise it is in downtrend. Yes we are in a short position since last 20 days, but we are in a good profit also. Look @ the chart study.

update 6, 10/02/2017, 06.27 pm,

Look @ the chart given below, NG price is trading on support line of 202, if it break it, then its good for us. But if it take support then it will bounce back, so keep the sl of 206 for our profitmaking short position. thank you.

Update 7 -- 13th Feb 2017, 12.27 pm

Cmp of NG is Rs 200 around. We entered short 24 days ago. Now we have 24 to 28 points profit in hand, that means more than Rs 30000 profit in single lot.
Book all the profit & exit the trade. Jay Shriram. Trade closed.