Sunday 3 March 2019

NG bounced from multiyear support

3rd March 2019,
02.30 IST.
NG Future w CFD
     As shown in the charts with digits 1 to 6, NG price took support on that supportline on 6 occasions in last 3 years and bounce back. Just before 2 weeks it touched the multiyear support line and turned upward. So I think it is good chance to enter a long trade. This trade can take its own time because this chart is on weekly time frame. Stop Loss should be placed below support line. For MCX that support line is now placed at RS 185, so you can place stoploss below that mark. In the past that level placed around Rs 165 but weakening of Indian Rupee against U.S dolor placed it around Rs 185 now. MCX CMP is Rs 203.
   Do your proper research and think about it, Jay Shriram.   

Update 1, 29th May 2019

   ng weekly 
      As shown in the weekly chart of NG, price again took support from multiyear support line. Actually it breached this line with exponential leg near the mark '' 7 '' . But that was because of sl triggered in large quantity. I am still holding my long position. Made average at lower levels with big quantity. Now I have average cost of Rs 190 MCX India. 
     Lot of patience needed to make profits from Ng. Nearly 3 months are passed holding this bet. But one should acknowledge that NG is play of fundamentals. Supportline on weekly chart shows the price level, where demand from power plants and other users increase & producers feel less happy to produce more. So impact of this will turn price upward again. One should read an article by HFIR energy on seeking alpha. Here is the link .....  https://seekingalpha.com/article/4266894-natural-gas-lower-prices-cure-lower-prices
     Cmp on mcx India is 182 & I am happily holding my long position. Thanking you, Jay Shriram. 


Thursday 10 January 2019

Zinc in a downward trend

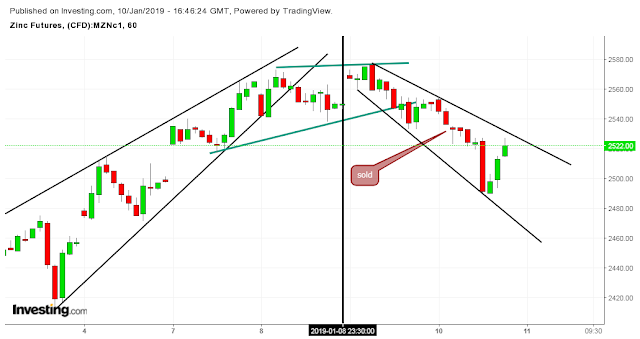
     As shown in the hourly chart of zinc, price came out of bear wedge. It should drop down as soon as it got break out from the support line of the bear wedge but because of the fundamental news about Trump - China , price hover at higher levels. It threatens lot about violating wedge pattern but finally it starts its journey to right direction which is downwards.
     CMP is 2526 and on MCX India it is quoting Rs 175. I shorted it already. 
     Jay Shriram. 
Update first, 10.15 pm IST
zinc hourly
     Posted zinc hourly chart is showing mirror image. Price rose in ascending wedge chart pattern. after breakout from wedge it hover horizontally for 8 hours and start falling. But amazing fact is that , price is falling in mirror pattern. You can see mirror image of left hand rising ( bear ) wedge to your right hand and price is respecting both support line and resistance line of it. Amazing live show is going on in zinc hourly chart and same time mirror pattern is going on in gold 15 min chart. I posted it on my twitter handle. To get such timely updates , follow me on twitter.
     Important thing is that our position is in profit, but price is not falling vertically, it is going down making lower high lower low. It will take its time to go down and I hav lot of patience to wait. that's it at this moment. Jay Shriram.


Monday 7 January 2019

Bear wedge beakout on Gold hourly

gold hourly
     As shown in the hourly chart of gold, you can see price came out of bear wedge giving a valid down ward breakout. So I sold gold at 1290.27 and on MCX India 5 Feb contract on Rs 31,645.
     Price took resistance from 78 % fib level and return downward. It may be correction or just a pull back. I don't care about that. I want little money from this trade set up and thats it.
     Jay Shriram.
First updae 01.06 pm IST
gold hourly 
     MCX India gold 05 Feb contract price is Rs 31570 and $ 1283 on CFD. We have now 75 rupees profit, so book half the profit and trail your stoploss.
     As you can see price broke out from bear wedge yesterday and fall vertically till 50 % fib level. Took support there for 8 hours ( 8 candles ) and fall again. Price is resting on last fib support of 23 % now. Lets see, what will happen. Now we book half of the profit and using trailing sl method to protect remained profit. So guys, we have nothing to loose. So enjoy the scene chatting Jay Shriram.


Friday 4 January 2019

Descending tringle on gold 15 min

gold 15 min
     This is short term intraday trade idea. chart used is 15 min chart. Lower high lower low is clearly visible. Descending triangle chart pattern. 
    Sell below support line ( mcx India Rs 31745 ) of the triangle for little quick gains. Jay Shriram.
Update first, 4th Jan, 02.46
gold 15 min
     Within few minutes our trade has turned in a profitable trade. Price breached supportline and went down. CMP is 1293.22 & MCX price is Rs 31715. Use trailing sl method to protect profit's.
Jay Sriram.
Update second, 4th Jan, 08.04 pm IST
gold 15 min
     CMP is 1282.30 , very good profit in intraday. I am closing my position because I am satisfied with profits. Cmp on mcx India is Rs 31540. Nearly 200 points/ 1kg lot. That means Rs 20000 / lot. Jay Shriram.


Thursday 3 January 2019

Long copper

copper hourly
copper 15 min
     As drawn on the hourly & 15 minute copper chart, price came out of the bull wedge on hourly chart but not spiked up. But on 15 min chart I can easily smell the upmove because of the smaller period exponential moving averages are crossing longer ones. 
    Price is 2.609 & Rs 407.30 on MCX India. I took the long trade. Let's hope for good. Jay Shriram.
Update first, 4th Jan 02.35 IST
copper hourly
     In last 24 hours, price went down & came back at the point, where we bought the long trade. Here is hourly chart & price is 2.610 but it is trading with 2 rupees discount on MCX because of lack of proper volume. It will uplift itself within next few hours.
     Price is quoting above black trend line, above 12 MA, convergence line of Ichimoku crossed base line upwards, Supertrend gave buy signal. Everything is with our trade. Let's hope for good. Jay Shriram.
Update second, 4th Jan, 09.34 pm IST
     Finally our trade is successful. Price went above ichimoku cloud, I am using trailing sl method to protect my profits now. CMP is 2.635. We bought long position at 2.609. On our local Indian MCX copper price is trading at Rs 408 above, we entered at 407 around. I am unable to understand Rs 2 discount on MCX price for copper. There is no big volatility on forex front regarding USD/INR. God knows the reason. Enjoy profits saying Jay Shriram.
Last update, 7th Jan, 11.40 am IST
copper hourly 
     CMP of copper is Rs 409 + on MCX India & 2.644 as CFD . We are now in profit. I am going to stop updating this post because you can use trailing sl method and protect or book your profits now. Enjoy profits, Jay Shriram.