4th July 2023,
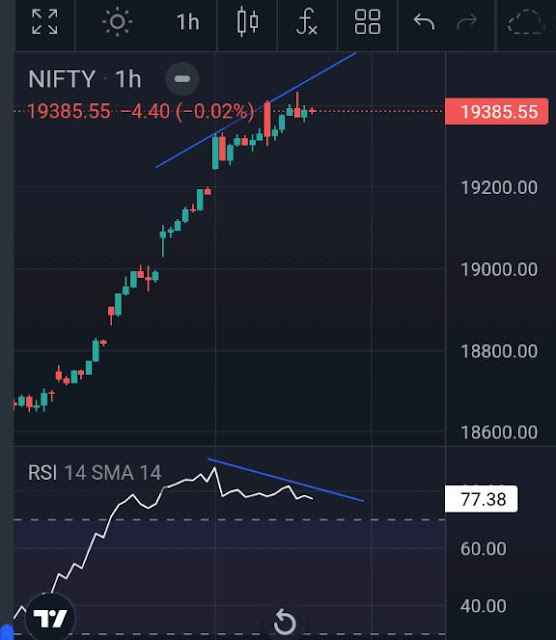
Today's ongoing daily candle is making hammer at top. It will confirm at closing today but last four candles made Sanku candlestick pattern which is rare pattern but indicates trend reversal in very near future. Same time RSI entered in overbought zone on daily chart.
The Three Gaps Up pattern plays out over four or more days, and the signal is quite unique in its flexibility, as the three gaps do not need to be consecutive. If you believe that you have spotted the Three Gaps Up pattern, look for the following criteria:
First, a well-defined upward trend must be in progress. Second, there must be three gaps (hence the name) within the uptrend. A gap, by the way, is an unfilled space or interval between the bodies of two candlesticks, and it indicates that no trading has occurred during that window of time.
That’s it! That’s all there is to it. Ideally, however, the gaps will be close together and the candles will all be white. The image above shows a lovely example in which the three gaps are consecutive and all four candles are bullish.
Like many candlestick patterns, the Three Gaps Up has a similar but opposing brother: the Three Gaps Down candlestick pattern. Both signals contain at least four candles and three gaps and herald a change in trend, but the Three Gaps Down signal moves downward while the Three Gaps Up signal moves (you guessed it!) upward.
So what does this all mean? Well, for three days the bulls are in control, and the price flies upward, gapping between sessions. The market is overbought, and exhaustion is inevitable. After all that climbing, the market will likely reverse, allowing the bears to take the reins. Thus, when you have spotted all three gaps, you can safely assume that a reversal is on the horizon.
To improve the Three Gaps Up pattern’s reliability, don’t rely solely on it. Instead, combine it with other technical indicators that point to the same conclusion. RSI diversion can be used .
Finally, any trader worth his or her salt knows how crucial it is to check for confirmation before pressing onward. So if you spot the Three Gaps Up pattern, look for the price to fall, reaching at least the midpoint of the last white body, to confirm the trend’s reversal. If it fills the last gap, you can be certain a reversal has occurred. Jay Shriram.


