Sunday 31 July 2016

NG daily chart flag pattern analysis

Ng flag pattern on daily chart, tgt Rs 240 mcx

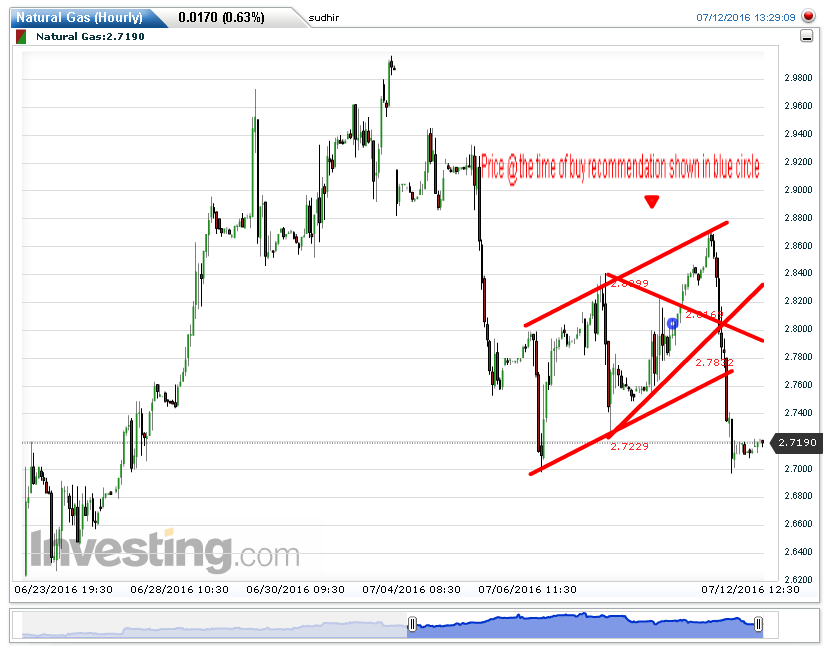
In attached daily NG chart we can see flag pattern is just ended. The flag pattern is continuation pattern. This  flag pattern has a rectangular shape, while the pennant looks more like a triangle. These two patterns are formed when there is a sharp price movement followed by generally sideways price movement, which is the flag or pennant. The pattern is complete when there is a price breakout in the same direction of the initial sharp price movement. The following move will see a similarly sharp move in the same direction as the prior sharp move. The complete move of the chart pattern - from the first sharp move to the last sharp move - is referred to as the flag pole. 
The volume, as with most breakout signals, should be seen as strong during the breakout to confirm the signal. Upon breakout, the initial price objective is equal to the distance of the prior move added to the breakout point. Here,  prior sharp up movement was from 2.1000 to 2.9800, then the resulting price objective from a price breakout of 2.7000 would be 3.62 ( 2.7000 + 0.9280 ). 
It looks very greedy but this chart pattern rule tell us the same targete price. 
On moving average front, 10 dma is about to cross 20 dma upwards. %0 dma is also moving in upward direction. 
For mcx NG Rs 180 ( breakout point ) + 60 ( fagpole ) = Rs 240. 
One more requirement to be fulfilled for this chart pattern is It is that ,the price movement prior to the flag or pennant be a strong, sharp move. Looking at the attached chart we can easily see that the prior to flag move was sharp one.
Conclusion is that , NG is in a breakout condition of flag chart pattern on daily charts. Price can go upward to Rs 340 mcx. This is pure technical analysis but we should keep in mind that heat wave is cutting Natural Gas storage glut since last 2 weeks.

 You can read this post as a article on investing.com, comment - analysis section also. link ------- 
http://in.investing.com/analysis/ng-daily-chart-flag-pattern-200145154

Zinc in upward moving channel

Zinc in a upward channel 
As seen in the attached daily chart of zinc daily, we can see a symmetrical triangle ( coil ) in between 4 th april to 20th may. After completion of this pattern, price entered in a upward moving channel. After entering in a upward channel price touched 2 times to resistance channel ( point 1 & 3 ) and returned to support line ( point 2 & 4 ). Price respected both lines, i.e - resistance & support line. This structure clearly indicates that price is going upward strictly within the channel. On thursday & fiday price touched support line @ point 4 & again turn upward.
This all scenario tells us that now price is moving towards Rs 157 mark where resistance line is placed. But keep in mind that, if it moves fast , only then it will touch resistance line around 156. As it takes more time to move up, resistance line will also go upward.
Wave count or elliott wave theory is nothing but a simple dow theory based on higher tops & higher bottom or lower tops or lower bottom. As per this theory 4 th wave end @ Rs 145 & now price is in 5 th upward wave which can take price towards 156 mark.
Resistance is placed around 153, which is last top .
Moving averages are bullish and there is support of 20 day moving average shown in red color line.
Conclusion -- After crossing 153 mark and sustained price can hit 156 above, there is support @ supportline, which is also upmoving. So support is now placed around 147. As the days pass, support price also push itself up and up.
You can read this article on investing.com website, in comment - analysis section. link ---- 
http://in.investing.com/analysis/zinc-in-upward-moving-channel-200145153
Update 1 --- 04/08/2016
 As shown in this attached hourly chart, zinc price touched Rs 153.26 price and turn down on 2nd aug. It took resistance there. Our level works very well. 

Zinc in upward moving channel

Zinc in a upward channel 
As seen in the attached daily chart of zinc daily, we can see a symmetrical triangle ( coil ) in between 4 th april to 20th may. After completion of this pattern, price entered in a upward moving channel. After entering in a upward channel price touched 2 times to resistance channel ( point 1 & 3 ) and returned to support line ( point 2 & 4 ). Price respected both lines, i.e - resistance & support line. This structure clearly indicates that price is going upward strictly within the channel. On thursday & fiday price touched support line @ point 4 & again turn upward.
This all scenario tells us that now price is moving towards Rs 157 mark where resistance line is placed. But keep in mind that, if it moves fast , only then it will touch resistance line around 156. As it takes more time to move up, resistance line will also go upward.
Wave count or elliott wave theory is nothing but a simple dow theory based on higher tops & higher bottom or lower tops or lower bottom. As per this theory 4 th wave end @ Rs 145 & now price is in 5 th upward wave which can take price towards 156 mark.
Resistance is placed around 153, which is last top .
Moving averages are bullish and there is support of 20 day moving average shown in red color line.
Conclusion -- After crossing 153 mark and sustained price can hit 156 above, there is support @ supportline, which is also upmoving. So support is now placed around 147. As the days pass, support price also push itself up and up.
You can read this article on investing.com website, in comment - analysis section. link ---- 
http://in.investing.com/analysis/zinc-in-upward-moving-channel-200145153
Update 04/08/2016
 As shown in this attached hourly chart, zinc price touched Rs 153.26 price and turn down on 2nd aug. It took resistance there. Our level works very well. 

Now you can follow me on twitter & google+

Finally I  added twitter & google+ follow buttons to my blog, from which you can get latest updates on blog posts. Request you to try for the same.

Friday 29 July 2016

Flag chart pattern on NG hourly chart

Flag pattern on NG hourly chart

As seen in the chart, there is flag pattern developed. In this case the trend is expected to continue when the price moves above the upper trendline. No need to say that, " it is bullish pattern or continuation of the trend."  
Update 1, 09.09 pm ( India )

As seen in this chart, there is length of flagpole shown, which is around Rs 14. As a rule of flag pattern , flag top + flagpole length = 207. So this pattern shows the tgt of Rs 207.
Keep in mind that NG is too much risky commodity to trade.

silver wave count

Silver, 5th wave tgt Rs 50000 ????

As seen in attached silver chart, silver is in 5th wave. I think it can go up to Rs 50000 around. Some up & downs will be there.


Thursday 28 July 2016

Copper in a downward channel, go short below 327 mark

Enter short below 327

Study the attached chart carefully. Since yesterday fall, copper price is moving in a downward channel, it sustained within the channel for whole day today. You can see second last candle, attempt failed to cross resistance line of the channel placed near 330 and it returned back in channel. Now price is 329.55 mcx. Looking @ the chart structure, it should come down towards 323 to 324 , where it will get support from the support line of this channel. Take positions only after price break below 327 mark, which is now support.
Make your study carefully and then trade, use sl for protection of capital. Wish you happy trading.
Update 4th aug 2016
 Nothing to say in words, today's chart is attached here. 

NG intraday chart levels

NG just broke intraday resistance before inventory comes in.

Look @ NG, zooms up 
As said in the last analysis on NG, it is in expanding triangle, which is bearish sign. But 2 the end of that analysis i said," NG is weather sensitive commodity on demand side." Result is here. Read my last post on NG carefully, visit the given link and read weather related article. Thank you .

Gold broke resistance of 31151 upwards & entered in bullish zone.

Gold in bullish zone


As seen in attached hourly chart gold price broke the resistance of 31151 & sustained above it. Next resistance is placed @ 31341 around. Now 31151 mark will play as support as rule of polarity. If gold break R2 it can zoom up to 31800 around.
But looking @ steam of upmove , chances are bleak that it can spike up to 31800 level. Bull power indicator is placed around 200 and maintaining itself above 0 mark.
Trade according to given levels, use sl to protect capital, wish you happy trading.

Wednesday 27 July 2016

Copper @ its support point, can reverse on upside

copper @ its major support, if reverse then can go above 340

As seen in the chart, copper price is @ its major support. This support is major support because there are 2 support points. If make reverse on upside, it can break resistance of 340 and fly upward, if breach 328 level on downside, then it will enter in bearish phase.
Trade accordingly.
it broke support and enter in to bearish field, while typing .


NG in Expanding Triangle

NG daily

NG Hourly 

As shown in the daily & hourly chart we can see that NG is moving within expanding triangle or reverse symmetrical triangle. This is bearish pattern. NG price can go down after ending of this triangle.
Keep in mind that NG is most sensitive commodity to weather reports, supply data. Trade accordingly.
Fundamental update - 1 , 27/07/2016, 08.43 pm ( Indian time )
http://www.ino.com/blog/2016/07/heat-wave-to-cut-natural-gas-storage-glut/?a_aid=CD3116&a_bid=e69e6702#.V5jOdPl97IU

Heat Wave To Cut Natural Gas Storage Glut ---- click on given link and read full article.


Interesting article about copper

http://in.investing.com/analysis/history-repeats-itself:-copper-200143834

Mentioned link is a article by Pratin Gandhi on investing .com, very interesting view and analysis by him on copper. Traders should visit the link and read this article. Copy paste the link on your browser & you will on the page of article.

Tuesday 26 July 2016

26/07/2016,  09.00 pm india

crude hourly chart 
I have nothing new to say, just look 2 chart and you find that price is not going anywhere, it is intact in a downward channel, made 3 tops and 3 bottoms, moving towards 42 dolor mark

Sunday 24 July 2016

24/07/2016 , Gold buy above 31151, sell below 30669 


As stated in heading, one can go for buy if gold sustained above 31151. But looking @ moving averages and bear power, I dont think that anybody can see the price above 31151. On the other hand, if price broke the 30669 level and sustain you can see big down fall. I will never trade between these two levels, 30669 to 31151 is " no trading zone " for me. Wait for any level to breach, waiting for good level to trade is most important part of trade.

update 1, 26th july 2016
houly chart gold mcx 
  As seen in ataached chart, gold price touched R1 and returned back in no trading zone. This is the power of level's mentioned in charts. Yesterday I said that, go short below 30669 if sustained. In circle , you can see price touched exact figure and returned.
Now wait for either levels to break and only then enter in position, long or short. 

Saturday 23 July 2016

copper, chance to enter long for 4 points.


chart 2 , copper daily

Support & Resistance
As shown in the daily chart 329 is major support, if sustained below it, then next support is placed @ 317. But chances of bear move is less than bullish move. Resistance is placed near 340, if breach it then first tgt is 345 and after crossing it price can spark towards 370.
Hourly chart , intraday trading levels 

Study very carefully attached hourly chart, you can see circles named A-Z, A-Z, A-Z & A. Yes now we are @ 4th A, which is placed @ Rs 333.25. We can expect Z around 337 to 338 +. 

conclusion

One can go for buy @ cmp Rs 333.25 for the first tgt of 338 around, if price moves and sustain above 340 level then 345 followed by 369. But that is not intraday trading. Better is to book 3 to 4 points profits and enjoy to see sms of positive mtm on your mobile. Book profits regularly and use trailing sl method. Yesterday we did the same and booked profits. @ the end of the day price collapse to point A. Thank you, keep visiting, if you like the post or dislike it, please mention in comment box.

23/07/2016, crude bull bear power

crude daily chart, 23rd july, saturday.
Today is holiday for all exchanges, this is the chance for every trader to do homework. Today I selected bull & Bear power indicator tool. Look deeply @ black circles & you will find that when this bear power yellow color enter below 0 or minus area we get indication of future down trend and that is before the price actually move down in big way. Same thing is about the Bull power indicator. 
For example, count the last 12 candles in attached daily crude chart.  Look vertically down to bear power indicator, it is placed below 0, near around - 20. You will come to conclusion that bear power gave us clear indication of fall around Rs 3200 price level before actually fall starts in big way.
You can use it in your daily trading for intraday purpose also.

Important link --- fundamental & demand supply
According to market experts, elevated stocks of fuel products amid slowing global demand growth is expected to keep prices under pressure in the near-term....... http://www.investing.com/news/commodities-news/crude-oil-futures---weekly-outlook:-july-25---29-416227
Update - 1, 25/07/2016 

crude hourly chart,
We are in good profits now. Use trailing sl method to protect your profits, trail the sl in profits only. There are no chances that crude will return in to bullish zone. Any rally will be short lived. Use it to enter in short position. 
Look @ the attached chart. Bear power indicator is in full form. Enjoy profits with trailing sl method.

Friday 22 July 2016

22/07/2016 copper levels

 As shown in chart, copper is near channel support, it broke channel but returned within it quickly. by using channel support line as long entry point one can enter in long keeping sl @ 333.80 which is current low.

If sustained below 2996, tgt 2950, 2900

22/07/2016 crude hourly

 22/07/2016 crude daily

As shown in daily chart, there is solid support @ 2996. Crude breach minor support of 3020. if sustained below 2996, then it can go towards the 2950 level & then 2900. Resistance is left far away, 3146 is resistance. If crude price mange to sustain above 3020 then chances are there that it can travel towards 3100 level again.

Thursday 21 July 2016

21/7/2016 intraday levels crude

crude oil hourly chart


crude oil daily chart 


Day strategy 
As mentioned in hourly chart, above 3115 price can go toward big resistance 3146. Below 3100 price can easily go towards 3020 levels as support is placed @ 2995 around. Keep in mind that crude is in medium term downtrend and anytime it can breach 2995 level. But to earn some mtm, we can use levels as it is range bound now.

Wednesday 20 July 2016

Crude support @ 3000, resistance @ 3101, 3146

 Today we are trading in new contract, which has premium of nearly 60 rupees. But with the helpthis 60 rupees premimum, crude price failed to show any positive breakout. Now the resistance is placed @ 3100 around foloowed by 3146. With this resistance levels in mind, one can enter in short positions using any upward movement. Today is inventory day. I am with the view that inventory will come negative for price. There is simple reason behind this view. In 1 week time span, no producer can increase or decrease the production suddenly. Nothing to write more about it, everything is posted in last post on crude. Wish you happy trading , thank you. Keep visiting.

Sunday 17 July 2016

safe commodity trades : Crude nearing solid resistance, chance to go short...

safe commodity trades : Crude nearing solid resistance, chance to go short...: Crude nearing solid resistance, chance to go short chart 1 chart 2  chart 3  Channels   As seen in chart no 1 & 2, ...

Crude nearing solid resistance, chance to go short

17/07/2016
chart 1
chart 2 

chart 3 

Channels 
As seen in chart no 1 & 2, crude price broke channel support line 25 days ago. It also broke sub channel downward. This channel is nearly 5 month old.
Declining Triangle
After that price moves in a declining triangle till 20 days and broke the triangle 6 days ago. After moving below the declining triangle support line, price moves between Rs 3000 - 3120 range. In last 6 days price attempted 3 times to move upward but in vain. Once it touch 3146 mark as spike high but return back. You can search google for the declining triangle characters and to see, " what will happen after ending of such pattern ?"

Turkish problem - chart 2 
In chart no 2, which is nymex chart, you can see higher size candle than placed in mcx price chart. It is because turkey problem, which is now resolved. 

Moving Averages 
10 dma & 20 dma crossed 50 dma downwards, which shows bearishness in price movement. I always use moving average because it gives clear indications of the trend. 

Hourly chart 

On hourly chart, we can easily see that Rs 3146 is solid resistance. This is very safe resistance as it is spike high and not a normal high. Again the channel resistance line is placed @ 3146 which gives bears exact sl price. In any way price should not cross Rs 3146 level.

Strategy 

Use each & every rally to go short keeping sl above Rs 3146 for the tgt of  Rs 2900 mcx. Wish you happy & safe trading, thank you.


Wednesday 13 July 2016

Copper, in its 6th attempt to break resistance

copper daily chart


Channel 
As seen in attached daily chart, copper is trying its 6th attempt to break Rs 140 resistance. These 6 points are shown by letters a, b, c, d, e & f. While doing this copper price break the channel resistance in little way. On the other side price respected support line on 2 occasions, i.e. x & y. If failed to break and sustain above 340 level, it should have to return support line again which is now placed below Rs 300. If it breaks resistance of Rs 340 and sustain, then new rally will start towards next resistance around Rs 355. 
Moving average
You can clearly see in the chart that 10 day moving avrage crossed 50 day moving average, it indicates short term bullishness in price.
Conclusion 
One should watch carefully the levels given in the chart & try to follow the trend. Never go against the trend but try to catch reversal. Below the channel resistance line, copper can turn towards support line. If sustained above resistance linewhich is placed around Rs 335, it can again try to break the major resistance of Rs 340 & if it go above that price then new big spike will be there which will take price towards Rs 355 level.
Reminder 
Wait for confirmation of down trend below resistance line to go short & wait for breaching and sustaining above 340 level to go long. Dont trade between channel resistance line and R 1. Thank you , wish you happy trade. Today, news is china weak import export figure.

Update 1 15/7/2016

Nothing has changed in last 2 days.Moving avrage of 20 days also turn up, showing bullishness in trend. Very confusing pattern, longs only above 340, shorts with strict sl.
Update 2 chart, 16/07/2016


Update 2 -- consolidation accumulation or distribution ? 


As edited in the chart, yesterday price try to go again to R 1 with a spike but failed & return back to Rs 334 mark. If you are thinking that price is unable to cross R 1 then it will turn bearish, be cautious, look @ moving averages. Now 20 dma is also showing bullishness with 10 dma & price successfully made a base between Rs 333 to 335.50. This is sign of consolidation accumulation & not of distribution. On the other hand as time is passing resistance line of the channel is coming down, as a result 334 mark is now above the resistance line of the channel. As a rule of polarity, now resistance line of the channel will work as minor support for the price. 
Strategy 
So we should change our mindset & wait for price crossing Rs 340 mark and sustain there, then we can take long positions for the tgt of 350 + . If price go below Rs 330 mark that will be good sign for shorters. Thank you, wish you happy trading. Keep visiting.

Tuesday 12 July 2016

Crude, history is repeating

Isn't it amazing ? History is repeating on daily charts. I have nothing to say in words. See the attached chart & you yourself can understand, where it is heading.

Crude heading towards resistance point

                      Crude resistance@  46 dolor or Rs 3,100

Channel 

As shown in the attached chart, crude has resistance @ 46 dolors or Rs 3100 mcx. Since 08/07/2016 it moving in a narrow channel, touched support line @ 2 occasions namely a & c points and currently trying to breach support line @ d point. It has to face resistance @ 45.80 and 46 ( Rs 3100 ) dolor point which is shown in blue line. If it successfully break the r1 & r2 , then it will return to some bullish mode otherwise it will return to support line with faster speed and try to breach it downward. 

                                         Moving Averages 

As shown in the chart, 5 dma crossed 20 dma on upside. Keep in mind that, this is hourly chart.

                                                 Strategy 

Watch carefully the levels given here with the chart. If price take resistance @ given points then it should return to support line and try to break it. If that happens then it will go directly 50 to 80 Rs downward. If it break 46 dolor upwards, then little bullish rally will start.
Use trailing stoploss method after entering in position to book profits and protect capital.
Thank you.

Updated chart 


As seen in the attached chart, crude price has taken resistance near Rs 3,100 and now it is trying to go up. Lets see, what will happen ?

2nd Update 


As seen in the chart, crude price break the resistance placed around 46 dolor or Rs 3,100 in good way. 

Monday 11 July 2016

                                   Update on copper analysis

Today Copper opened around 322 above. As a result our copper analysis posted yesterday proved in vain. SL level mentioned in sl is below opening price. Todays candle shown in red circle. See the attached daily chart. Thank you, enjoy the NG call.


Sunday 10 July 2016

Copper in free fall mode

                                      10/7/2016, Sunday.


Channel Pattern 

As indicated in attached daily copper chart, we can easily see that, copper price is moving in a donward moving channel since last 90 days. On 3 occasions ( a,c,e ) it touched resistance line. Price respected resistance line in this upward journey and came back to visit support line ( b & d ). In the third upmove it touched the resistance line and fall vertically. This point is shown in red rectangle.
There is another channel within the main channel, which is indicated by red lines. After returning from resistance line ( rectangle ), price breach support line of this blue colored channel ( circle ) around Rs 325 - 326 mark and as a result it got new steam for its down ward journey. 

                              Failure Of  Expanding triangle

Usually price fell after end of expanding triangle but here we can see the failure of this chart pattern. We can see this triangle colored in blue lines. Instead of going down price sparked upward and touched point e of resistance line.

                                        Moving Averages 

For the purpose of study of dma, 3 types of dma,s used here. (1) 5dma is shown in yellow line (2) 10 dma is shown in blue color line (3) 20 dma is shown in green color line. 5 dma line crossed 10 dma line in downward direction. As there are only 5 days or 5 candles in its downward journey, 10 dma line is yet to show new direction.

                                              Conclusion

Looking at channel structure and break of inner channel support line, we can hope that price will continue its journey towards main support line of big channel towards supportline placed around Rs 300 or 2.22 dolor mark. If we think only about main channel irrespective of inner blue colored channel, price is heading toward support line after visiting resistance line. Support line is placed around Rs 296 to 297. But there is support around Rs 300 or dolor 2.22 which is last time low, shown as point d. So keeping all this factors in mind I suggest to go short in copper @ cmp Rs 318 or 2.12 dolor for the targeted price of Rs 301 mcx or dolor 2.02 with the sl of Rs 321.60 mcx or dolor 2.15 around. Stop loss is placed @ the high price of last day candle. Hoping good profits from this trade, wish you best luck. Request you to use trailing sl method for safer profits. Thank you.

Natural Gas @ the edge of break up

                               NG @ the edge of breakout ?

Channel Pattern

As seen in the attached hourly Ng chart , price is moving in a upward moving channel since last 3 days. It touched 2.80 @ the resistance line of the channel and come down fast to kiss support line placed @ 2.70. Again price move upward and touch the resistance line placed @ 2.84 on second time. After touching resistance line price moved down sharply towards support line , which is placed around 2.73. After that price moves in consolidation phase but give respect to support line. After consolidation on hourly chart, price starts moving upward and now placed @ 2.8117, resistance line is placed around 2.88 -- 2.90.

                                           Moving Average 

On dma front , we can see that 10 dma ( blue ) crossed 20 dma ( green ) upwards and running upwards to cross 100 dma ( red ). Seeing the steam in which 10 dma is moving upward, it looks very much possible that it will cross 100 dma in very little time and 20 dma line will follow the suit.Watching channel line and dma structure we can expect that price is heading towards resistance line which is placed @ 2.88 to 2.90. 

                                              Symmetrical Triangle   

There is one important pattern of symmetrical triangle is devloping in this channel. It is powerful pattern. After completing the triangle price should breakout in the direction of prior trend & the trend is upward. In my prior analysis on NG i wrote only on this symmetrical triangle and after that price of NG made huge jump on upward and touch 3 dolor price but this time triangle is small compare to previous one but capable of breaking resistance line of the ongoing channel. Looking at the consolidation happened , price can break the resistance line and move upward towards 3 dolor resistance , as the thumb rule of three attempts.

Conclusion - one can go long on cmp Rs 189 around ( mcx ) for the tgt of 200 + with the sl of 186.

Update of analysis, 12/7/2016 


As shown in the attached chart, price moved upwards to the channel resistance line after breaking Symmetrical triangle. Price touch the resistance line @ the point of 2.87 dolor and turn back towards support line. This down move was very fast and with this force it broke the support line and went down.
Hope you booked your profits before it cross our long entry price downwards. We have enough time to book profits as seen in this hourly charts.
Nothing to saay more about NG because change of technicals demolish the previous chart pattern. Keep visiting to read ongoing patterns on varoius commodities.
Wish you profitable trading, thank you.