Saturday 25 February 2017

copper, on the edge of tumbling down ???

Copper, @ the edge of tumbling down ????

Study this daily copper chart levels carefully. Only after that, read the article.

From 16 th Dec 2016 onward copper is moving upward as shown in channel drawn in the daily copper chart. On 23rd feb 2017 copper break support line of this upward moving channel. Stay below the channel for last two days. There is always chances that, the commodity enter back in to channel after breaking these types of channels in either direction. But the rule is that if price broke channel downward then prior low is support & if price go below that support line, that is the confirmation of new trend.
In this copper case, copper came out of channel and kissed S1 on 23rd Feb 2017. Next day price went up creating a green candle & closed @ 394 rupees mark.
Prediction -- If copper break S1 placed @ 386 & remain below it for little time, it can go towards next support of 363. If it fails to take support @ this S2 then we can expect free fall of price till S3 which is placed @ 310.
Warning -- As this is daily chart, prediction can take time according to difference between time frame of hourly, daily chart. Usually traders use hourly chart, so keep in mind that this is daily chart. Second thing is that, after breaching the support line, one should wait for some time and make confirmation that price actually broke the support. This is essential for Safe Commodity Trades.
Hope you find this article helpful.
You can read this article on investing.com also. Link is -- https://in.investing.com/analysis/copper,-will-it-take-down-move--200176812?preview_fp_admin_1234=this_is_1234

Update 1, 27th Feb 2017, 05.50 p.m

symmetrical triangle on copper 30 min chart ? 

The symmetrical triangle, which can also be referred to as a coil, usually forms during a trend as a continuation pattern. The pattern contains at least two lower highs and two higher lows. When these points are connected, the lines converge as they are extended and the symmetrical triangle takes shape. You could also think of it as a contracting wedge, wide at the beginning and narrowing over time.
While there are instances when symmetrical triangles mark important trend reversals, they more often mark a continuation of the current trend. Regardless of the nature of the pattern, continuation or reversal, the direction of the next major move can only be determined after a valid breakout. 
Here we can see a downtrend in copper price. so I have nothing to write more about. You are wise enough to take yur decesions accordingly.
Read more about  symmetrical Triangle on following link ....  http://stockcharts.com/school/doku.php?id=chart_school:chart_analysis:chart_patterns:symmetrical_triangle_continuation

Update 2, 27th Feb, 08.41 p.m


Update 3, 28th Feb, 12.45 am, copper daily chart
tvc_c6c8c3f962f17646ce643dcacbe1eec9.png (918×556)


See, why I gave warning to wait for the confirmation. Copper took resistance from this confirmation line and turn southward.


| द्यूतं छलयतामस्मि तेजस्तेजस्विनामहम्‌ ।

| द्यूतं छलयतामस्मि तेजस्तेजस्विनामहम्‌ ।| भावार्थ : मैं छल करने वालों में जूआ और प्रभावशाली पुरुषों का प्रभाव हूँ । श्रीमद्‍भगवद्‍गीता >अथ दशमोऽध्याय:- विभूतियोग

उपर जो श्रीमद्भगवद्गीता जीका श्र्लोक लिखा है उसका मतलब यही है कि, " मै चोरोंमे द्यूत ( जुआ, speculation ) हू |" श्री भगवंत विभूतीयोग मे बताते है की," सबसे बडा चोर जुआ है | सबके सामने चोरी हो जाती है, लेकीन कोई चोर को पकड नही सकता |  
आप सोच रहे होंगे कि," आज ये आदमी शास्त्रीजी क्यों बन गया ?", मुझे रोज बहोतसे इमेल आते है | सारे के सारे इंट्राडे मे लॉस खाये हुए लोग ही होते है | मुझे आजतक ( from last 18 yrs ) एक भी ऐसा आदमी नही मिला, जिसने इस इंट्राडे ट्रेडिंग नामक जुए मे नियमित रूप से पैसा कमाया हो | फिरभी लोग ये गंदा काम करते रहते है | क्यों करते है ये उन्हिको मालूम होगा |
इससे तो अच्छा है कि, लॉटरी खेले | जैसे मिझोराम गुड मॉरनिंग, नागालँड गुडनाईट, सिक्कीम सरकार गुड आफ्टरनून |  लॉटरी मे एक बात अच्छी है | आपके जितने के चान्सेस ५०/५० % है | क्योंकी डिजीट १० होते है, ० से लेके ९ तक. अगर आप ५ अलग अलग नंबर कि  टीकीट निकालोगे तो आपका जितने का चान्स ५० % हो जाता है |
रही बात commodity ट्रेडिंग कि, तो इसमे ट्रेंड पकडना ही सबसे बडी कला है | जैसे कि NG उपर से नीचे कि तरफ जा रहा है, उसमे तेजी खतम हो गयी है , ये समज मे आना बहोत जरुरी है | एकबार आपने सही ट्रेंड को धुंड निकाला तो फिर आप किंग बनते हो | वो कमोडिटी आपको को profit मे ले जाती है | दिन गुजरते है, हफ्ते निकल जाते है, महिने निकल जाते है , आपका profit धीरे धीरे कम ज्यादा करते बढता रहता है |
अगर आपको ट्रेंड पकडना नही आता, तो ये पोझिशनल ट्रेडिंग आप नही कर सकते | गलत दिशा मे पोझिशन लेके अगर उसको चिपकके बैठे , stoploss नही युज किया तो आपका कॅपिटल खत्म हो जाता है |  
जरुरत नही है की, रोज ट्रेडिंग किया हि जाये | १५ दिन २० दिन कोई ट्रेड नही किया तो आपका का जाता है ? परफेक्ट ट्रेडिंग सेटअप मिले तभी ट्रेड करे | ट्रेडिंग जुआ नही है , ये एक व्यापार है |
इसिलीये मैने ब्लॉग के शुरवात मे हि, गिताजी का श्र्लोक डाल रखा है |
किसीको बुरा लगा हो तो बडे दिल से क्षमा किजीयेगा ," वैसे भी मै अभी परिपक्व नही हुआ हुं | सिर्फ ४१ उमर है मेरी , मुझे और थोडा समय चाहिये , धन्यवाद "

Friday 24 February 2017

Latest crude study

Some chart study on crude

crude is trying to break the support line of upward channel. If it break support of 3580 and stay below it for some time, then it will start falling downwards. Next support is placed @ 3530 @ 3460. 
On the other hand, if crude again entered in channel & move above 3668 then it will enter bullish zone & try to go towards 3750.
Again remind you that this is not trading call, just for info. Jay Shriram

Wednesday 22 February 2017

crude, higher top - higher bottom

22nd Feb 2017, 11.16 a.m

simple Dow theory, higher top-- higher bottom chart pattern formation is going on in crude. It is bullish chart pattern. You can see it by following no's 1-1, 2-2, 3. For intraday traders, go long and earn some money. Use support line as sl & R1 as tgt. Jay Shriram.

Update 1, 22nd Feb 2017, 07.3

Sl triggered @ 3617, sl hit, 42 points loss, that is Rs 4,200. Very sorry, thank you Jay Shriram.

tvc_7ea2e3f2a973dd2b2545f831cd3dc106.png (918×556)

Tuesday 21 February 2017

sell silver @ cmp 42702

Sell silver @ cmp 42702,  I will give sl and tgt & chart study in few minutes.

Update 1, 21st Feb 2017, 01.35 p.m

As shown in the silver hourly chart, you can see that, the silver price broke the channel support & made gap down. Later it filled the gap but it is in process to complete the H&S pattern. This is very bearish chart pattern, next big support is placed @ 42300 level, which will our target and channels support line , which is now placed around 43000 will be our sl. 
Try it, saying Jay Shriram.

Update 2, 03.00 p.m, 21st Feb 2017.

hurry up, book all the profits & exit the trade. cmp is 42480. we got 220 points that means more than Rs 6000. Enjoy, Jay Shriram
tvc_973c6afbba7d172b9851931bffbd4721.png (918×556)

Monday 20 February 2017

How the rule of polarity works ? How the resistance become support ?

I got many mails asking knowledge about technical analysis. Here i am presenting example of " rule of polarity " with the concept " trendline ". 
Today we exited the crude trade with the profit of Rs 3,500 to 4000. See the original past post namely buy crude @ 3570. In that post charts posted in update 2, update 3 & update 4. I am giving you that charts again here. Read remaining part of this post below the charts.


In first chart there is declining trendline, which made declining triangle. ( go to google to know meaning of declining triangle ). price of crude is locked within this triangle. You can see that, the price couldn't cross the trendline and so the trendline was become resistance for crude price.
In the second chart price break this trendline but failed to sustain above it and returned in triangle again. But with the second attempt , it crossed it upwards and sustained above it. So I wrote there that," now the rule of polarity will work. Resistance line become supportline now. 
See the magic of this technical rule of polarity, price had taken support with this trendline and fly upwards.
One of my blog reader always asks me by mail that," how can I got intimation before price action actually happens ?" Here is the answer shown in the charts. I never enter in a trade if I have no strong reason to do so. And the result is on this blog itself. Just calculate the profits from prior posts. as you all are my regular readers, you know that, here is nothing to hide.
Thank you, read & study this post very carefully with the help of Mr google. Hope that you all intraday guys will become expert in trendline, declining triangle and the rule of polarity by reading this post☺☺☺☺. Say Jay Shriram. 

Sell Lead @ cmp 152.25

Can sell Lead @ cmp 152.25, tgt is open, I will update stop loss & tgt latter. Do the trade, if you are positional trader. Short term or intraday traders keep away from this idea. It can take 20 days to 1 month for exit.Jay Shriram.

Update 1, 22nd Feb 2017, 10.39 a.m

After breaching the supportline placed @ 150.50, lead price will tumble down heavily. Intraday traders can also earn some money when it happens. Thank you, Jay Shriram.

Update 2, 23rd feb 07.50 pm

What is decending triangle ? look @ the chart and read the folowing post below it.
Given is the lead hourly chart. Descending Triangle is shown in the chart.
The descending triangle is a bearish formation that usually forms during a downtrend as a continuation pattern. There are instances when descending triangles form as reversal patterns at the end of an uptrend, but they are typically continuation patterns. Regardless of where they form, descending triangles are bearish patterns that indicate distribution. 
Because of its shape, the pattern can also be referred to as a right-angle triangle. Two or more comparable lows form a horizontal line at the bottom. Two or more declining peaks form a descending trend line above that converges with the horizontal line as it descends. If both lines were extended right, the descending trend line could act as the hypotenuse of a right triangle. If a perpendicular line were drawn extending up from the left end of the horizontal line, a right triangle would form. Let's examine each individual part of the pattern and then look at an example..... to read full article , visit http://stockcharts.com/school/doku.php?id=chart_school:chart_analysis:chart_patterns:descending_triangle_continuation

Update 3, 28 th Feb 2017, 04.35 pm, lead hourly chart,

tvc_3870c01012eb1ed6f4604839976d5f65.png (918×555)

This is a Lead hourly chart. You can see price moving in a downward channel. On many traders chatting platform, you can read that," the commodity is going upward again." But the chart says something different. Price is very much intact in downward moving channel, taking support from supportline & turn south from resistance line. Now it is kissing R1 152.17, Prior low 149.50 should work as S1. Then there is major support namely S2 which is placed @ 148. If Lead break this support then that will be a confirmation of major downtrend. Thank you.

Update 4, 2nd Mar 2017, 10.00 pm

Lead broke upward moving channel and entered in bearish environment today. See the chart and read remaining post below it.
You can see in this 30 min chart that, lead entered in up moving channel on 23rd Feb, from that day till today. But today it broke this channel downward in a significant way. Now it is confirmed that it is in bearish trend. I marked point from where it broke the channel. So we are with the trend. May be there are little up & downs but we finally get our tgt.

update 5, 3rd Mar 2017, 08.03pm

Now lead is trading in declining triangle. which often gives bearish breakout after completion of pattern. 

Update 6, 6th Mar, 10.54 am.

Look @ the chart, declining triangle -- bearish breakout.

Update 7, 7th mar, 01.15 pm

As seen in this 30 min chart, lead price retracement ( upward ) ends kissing our redline, which is shown in circle. This is rule of polarity. while in the down move, lead price took support from this support line , which is now become resistance line. same time 61% fib is placed there. Each and every thing is now with us. we can expect big fall anytime hereon.

Update 8, 15th March 2017, 05.33 pm

Rule of polarity worked. Lead price returned downward taking resistance from the prior support of 147. see the 30 min chart of mcx lead

Update 9, 18th Mar 2017, 02.00 pm

Lead mcx  daily chart.

please see the attached daily chart of lead. Price is moving in a downward channel. Even it is below middle line (red) of the bollinger band, which is bearish sign. It just touched resistance line of sub channel (green). What is wrong with it ? You can see the daily chart and suggest me. It is clearly moving down and down within the channel (down moving) touching support line and resistance line again and again. that's what I can read in the chart. If there is an mistake of reading the chart by me, please suggest me the same. Keep writing,

thanking you,
vaibhav

Update 10   24th Mar, 05.24 am

Evening Doji star on examples  
doji star bearish साठी प्रतिमा परिणाम                     2nd day candlestick is a doji
doji star bearish साठी प्रतिमा परिणाम
Lead chart 24 arch closing
MCX lead chart 

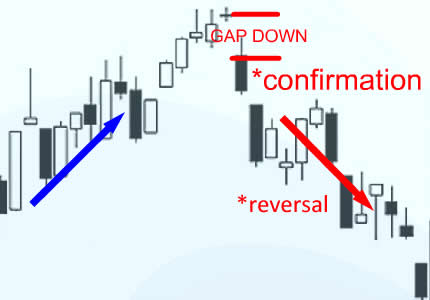
     The Evening Star and Evening Doji Star are top reversal patterns consisting of three candlesticks. Similar to the evening here on earth predicting that darkness will soon fall down upon the earth, the evening star candlestick pattern suggests that prices will fall. The first day of the evening star pattern consists of a long bullish candlestick after a preceding uptrend. Next, the second day candlestick gaps up, this means that the candlestick opens at a higher price than the first day’s closing price. The second day candlestick should be a little candlestick and technically, can be either bullish or bearish; but the main idea is that the real body of the second day is above the real body of the first day. 
     Lastly, the third day of the evening star pattern is a large bearish candlestick that closes well into the first day’s bullish candlestick real body. The charting package of ThinkorSwim (2011) requires that the third day candlestick close below the midpoint of the first day’s candlestick real body. Moreover, it is preferable if the third day’s candlestick gaps down, but this is not absolutely required for the pattern to be valid.
     In the case of MCX Lead same thing is happened and the Evening Doji Star appears. as this is reversal pattern, price is likely to go down significantly. On the first day of this candlestick pattern on mcx lead chart, there is long bullish ( green ) candle on 22nd March 2017. But point to be noted is that there is no gap up opening on second day which is yesterday 23rd March. First days close was 154,75 and second day opening marked at 154.45. But the  the real body of the second day is above the real body of the first day. 
     Conclusion --- Lead price can take reversal on downside from today onward. 

Last update, 19th april 2017.

mcx lead daily chart 
This is last update on this lead post because we booked our profits yesterday around Rs 136. We shorted it at 152 -- 153 around before 2 months. It was very difficult to hold position for such a long period, but we hold it and got profit of more than Rs 80000 in single lot short position. there were many occasions when we hold this position in loss, price went up to 157 + but we hold it. finally god gives us gift of this profit.
     I am closing this post now. Last few words about lead --- use every rise in 
price to create short position because it is in declining triangle on daily chart. 
you can see it in attached chart.
     Thanking you, Jay Shriram.


Tuesday 14 February 2017

Buy crude @ cmp 3570

Buy crude oil @ cmp 3570, 14th Feb 2017, 09.08 p.m

Buy crude oil @ cmp 3570 with the sl of 3510 for the minimum tgt of 3620, actual tgt is 3700 + , manage profit booking @ your own. Don't wait for me to update. It is positional call but crude sl can hit in todays session also. 


Update 1, 15th Feb 09.50 pm

We are @ the same price from where we start the trade. As expected crude took the support near 3540 & turned upwards but it is essential for bullishness that price should break the first resistance placed @ 3589. If it failed then there will be lower top lower lows chart formation. And as per Dow theory if the price breach second low (which is around 3540), price will tumble down like Jack & Jill poem. Lets hope for good. Jay shriram.
Update 2, 16th Feb, 05.00 pm

crude is trading in declining triangle on weekly charts, just see it & you will find that, resistance line of this triangle is declining as time is passing. At the moment the resistance line is posted @ 3565 and price is knocking it. If price cross the line then next resistance on upside is 3580, if failed to cross then 3530. very crucial situation.

Update 3, 17th Feb, 05.19 p.m

As a rule of polarity, now resistance line of prior triangle is become support line. There is only R2 remains as resistance because R1 is breached by price yesterday. So as technical chart showing there is support at triangle r line and resistance @ 3590 only. I can see that there is higher top higher bottom formation is going on, on this hourly chart, which has shown in digits 1-1, 2-2, 3-3?

Update 4, 20th Feb 2017, 04.10 p.m

CMP is 3640 around. Please book all the profits & exit the trade. We shorted crude @ 3570 + 35 rupees carryforward premium = 3605. CMP is around 3640, means we got 35 to 40 points profit. In rupees we got Rs 3,500 to 4000 profit. Yes it is very little profit but enjoy it saying Jay Shriram. 
 

Monday 13 February 2017

Todays commodity view

Todays commodity view, 13 th Feb 2017, 12.12 pm

Remember these are only views & not calls as I am not intraday trader. I hate intraday view.
Crude -- cmp 3600, bullish with support of 3540, can go towards 3700.
Copper --- cmp is 414, gap on hourly chart between 408 to 412, bullish, one can buy near 408 -- 409.
Ng -- cmp is 200, bearish view, very near to our tgt of previous NG call

Thursday 9 February 2017

Short copper below Rs 388

Study the given hourly & daily chart of copper & short copper if it breach the given support lines.


As shown in the hourly chart, there are 2 support lines near 387 & 388 for copper price. If price breach these lines, it can tumble down. Again question arises about target. Many readers confuse about it and ask me by mail. But for tgt, study the geven daily chart and look @ the S3 line which can be next stop for copper. Which is placed @ 372 around. But I know that, you guys are typical intraday type guys, you can watch the given levels, if copper price breach s1 , s2 then go short on it and earn some money. Thank you & Jay shriram.

Update 1 -- 12.48 pm, 11th Feb 2017.

Short copper call is not initiated. Price took U turn & turn upward from389. So call is closed. Yes, this the great aspect of positional trading. If we not get the correct chart structure, we should not trade. We lost nothing. Thank you, Jay Shriram.

Friday 3 February 2017

safe commodity trades : short crude below 3568

safe commodity trades : short crude below 3568: Short crude if it will breach the level of 3568 & stay there for a while. Read the below given hourly chart very carefully. And only aft...

short crude below 3568

Short crude if it will breach the level of 3568 & stay there for a while. Read the below given hourly chart very carefully. And only after that start reading.
As mentioned in the chart & shown in the prior post, crude is in the no trading zone of 3570 to 3670. If it breach the support line of 3568, then and only then go short. After that, price will go to take suport from channel resistance line. Which will go down & down, as it is southmoving channel.
Thank you.

Update 1, 4th Feb 2017, 01.17 pm. 

CMP is 3615. wait for given price 3568 below to go short on crude. If it will not happen, then wait for few days or hours. That will give us some technical advantage. It is not binding to us to trade on daily basis and loose money. Wait for good chart structure to enter trade. Thank you. 
Update 2, 8th feb 2017, 03.37 pm.
Book complete profit and exit the crude short position. We shorted it @ 3568 and cmp is 3480 around. We have nearly 90 rupees profit in hand.i.e. Rs 9000 in single lot. so hurry up guys. It can not go below 3400. So book your profit. Jay shriram


Thursday 2 February 2017

Crude - waiting for a good chance to enter short trade

2nd feb 2017, 11.25 am, Yes, I am watching crude movement since last few days and waiting for a good chance to enter a short position. Look @ the chart carefully and only then read.
From 27 th Jan 2017 Crude is in a down move. I draw a channel to show the down move. Price broke the channel resistance line around 1st Feb. Point to be noted that this is hourly chart. After breaking channel upwards and gained Rs 30 & made a high around 3620. Again it dropped but took support of upper channel line. Again this rule is proved that," if price broke resistance line and stay above it for considerable time, the resistance line becomes support line." Here you can see the same is happened. Rs 3640 & 3700 is the resistance but if price break last low of 3560 then it will go to take support from channel line , which is going down & down as the time is passing away. I show this down moving tgt in red arrows. This is not trading call. Just for info.