NG @ the edge of breakout ?

Channel Pattern
As seen in the attached hourly Ng chart , price is moving in a upward moving channel since last 3 days. It touched 2.80 @ the resistance line of the channel and come down fast to kiss support line placed @ 2.70. Again price move upward and touch the resistance line placed @ 2.84 on second time. After touching resistance line price moved down sharply towards support line , which is placed around 2.73. After that price moves in consolidation phase but give respect to support line. After consolidation on hourly chart, price starts moving upward and now placed @ 2.8117, resistance line is placed around 2.88 -- 2.90.
Moving Average
On dma front , we can see that 10 dma ( blue ) crossed 20 dma ( green ) upwards and running upwards to cross 100 dma ( red ). Seeing the steam in which 10 dma is moving upward, it looks very much possible that it will cross 100 dma in very little time and 20 dma line will follow the suit.Watching channel line and dma structure we can expect that price is heading towards resistance line which is placed @ 2.88 to 2.90.
Symmetrical Triangle
There is one important pattern of symmetrical triangle is devloping in this channel. It is powerful pattern. After completing the triangle price should breakout in the direction of prior trend & the trend is upward. In my prior analysis on NG i wrote only on this symmetrical triangle and after that price of NG made huge jump on upward and touch 3 dolor price but this time triangle is small compare to previous one but capable of breaking resistance line of the ongoing channel. Looking at the consolidation happened , price can break the resistance line and move upward towards 3 dolor resistance , as the thumb rule of three attempts.
Conclusion - one can go long on cmp Rs 189 around ( mcx ) for the tgt of 200 + with the sl of 186.
Update of analysis, 12/7/2016
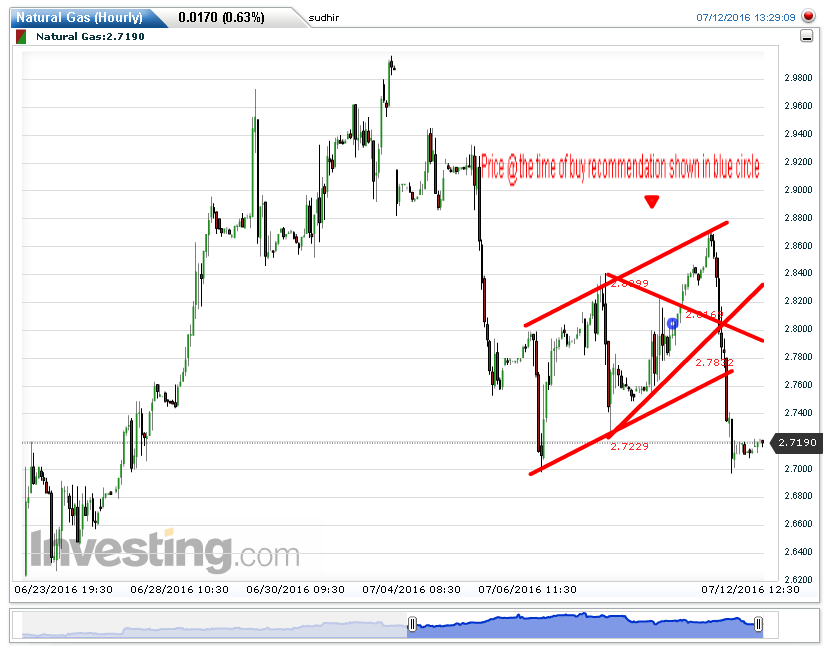
As shown in the attached chart, price moved upwards to the channel resistance line after breaking Symmetrical triangle. Price touch the resistance line @ the point of 2.87 dolor and turn back towards support line. This down move was very fast and with this force it broke the support line and went down.
Hope you booked your profits before it cross our long entry price downwards. We have enough time to book profits as seen in this hourly charts.
Nothing to saay more about NG because change of technicals demolish the previous chart pattern. Keep visiting to read ongoing patterns on varoius commodities.
Wish you profitable trading, thank you.
yes it works, ng is above 192
ReplyDeleteThankyou so much for sharing this information with us.
ReplyDeleteGold verkaufen
Goldberlin