Showing posts with label Free call. Show all posts

Tuesday, 14 February 2017

Buy crude @ cmp 3570

Buy crude oil @ cmp 3570, 14th Feb 2017, 09.08 p.m

Buy crude oil @ cmp 3570 with the sl of 3510 for the minimum tgt of 3620, actual tgt is 3700 + , manage profit booking @ your own. Don't wait for me to update. It is positional call but crude sl can hit in todays session also. 


Update 1, 15th Feb 09.50 pm

We are @ the same price from where we start the trade. As expected crude took the support near 3540 & turned upwards but it is essential for bullishness that price should break the first resistance placed @ 3589. If it failed then there will be lower top lower lows chart formation. And as per Dow theory if the price breach second low (which is around 3540), price will tumble down like Jack & Jill poem. Lets hope for good. Jay shriram.
Update 2, 16th Feb, 05.00 pm

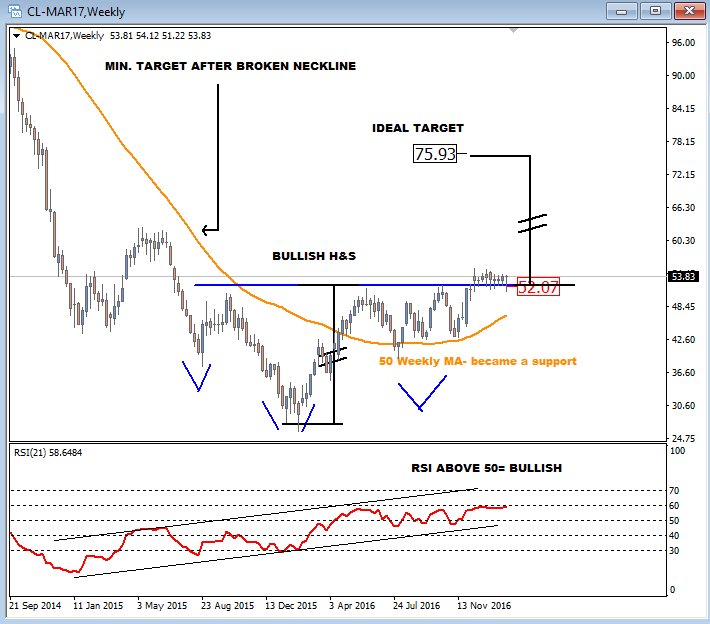
crude is trading in declining triangle on weekly charts, just see it & you will find that, resistance line of this triangle is declining as time is passing. At the moment the resistance line is posted @ 3565 and price is knocking it. If price cross the line then next resistance on upside is 3580, if failed to cross then 3530. very crucial situation.

Update 3, 17th Feb, 05.19 p.m

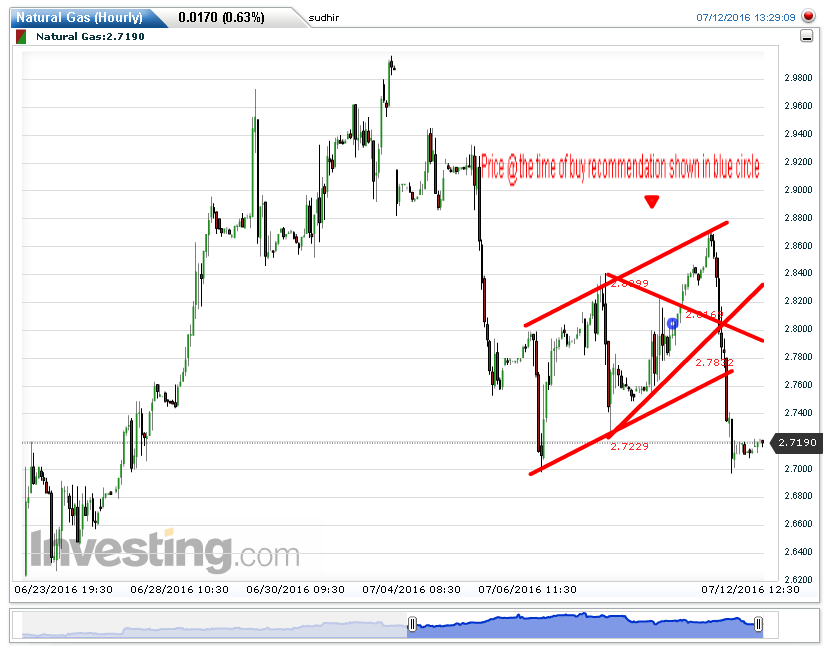
As a rule of polarity, now resistance line of prior triangle is become support line. There is only R2 remains as resistance because R1 is breached by price yesterday. So as technical chart showing there is support at triangle r line and resistance @ 3590 only. I can see that there is higher top higher bottom formation is going on, on this hourly chart, which has shown in digits 1-1, 2-2, 3-3?

Update 4, 20th Feb 2017, 04.10 p.m

CMP is 3640 around. Please book all the profits & exit the trade. We shorted crude @ 3570 + 35 rupees carryforward premium = 3605. CMP is around 3640, means we got 35 to 40 points profit. In rupees we got Rs 3,500 to 4000 profit. Yes it is very little profit but enjoy it saying Jay Shriram. 
 

Saturday, 11 February 2017

See, what Grega Horvat is saying about crude.


Crude oil is moving sideways for the last few week, a correction that will take us higher i believe. for now, above the neckline

Thursday, 2 February 2017

Crude - waiting for a good chance to enter short trade

2nd feb 2017, 11.25 am, Yes, I am watching crude movement since last few days and waiting for a good chance to enter a short position. Look @ the chart carefully and only then read.
From 27 th Jan 2017 Crude is in a down move. I draw a channel to show the down move. Price broke the channel resistance line around 1st Feb. Point to be noted that this is hourly chart. After breaking channel upwards and gained Rs 30 & made a high around 3620. Again it dropped but took support of upper channel line. Again this rule is proved that," if price broke resistance line and stay above it for considerable time, the resistance line becomes support line." Here you can see the same is happened. Rs 3640 & 3700 is the resistance but if price break last low of 3560 then it will go to take support from channel line , which is going down & down as the time is passing away. I show this down moving tgt in red arrows. This is not trading call. Just for info.

Saturday, 23 July 2016

copper, chance to enter long for 4 points.


chart 2 , copper daily

Support & Resistance
As shown in the daily chart 329 is major support, if sustained below it, then next support is placed @ 317. But chances of bear move is less than bullish move. Resistance is placed near 340, if breach it then first tgt is 345 and after crossing it price can spark towards 370.
Hourly chart , intraday trading levels 

Study very carefully attached hourly chart, you can see circles named A-Z, A-Z, A-Z & A. Yes now we are @ 4th A, which is placed @ Rs 333.25. We can expect Z around 337 to 338 +. 

conclusion

One can go for buy @ cmp Rs 333.25 for the first tgt of 338 around, if price moves and sustain above 340 level then 345 followed by 369. But that is not intraday trading. Better is to book 3 to 4 points profits and enjoy to see sms of positive mtm on your mobile. Book profits regularly and use trailing sl method. Yesterday we did the same and booked profits. @ the end of the day price collapse to point A. Thank you, keep visiting, if you like the post or dislike it, please mention in comment box.

Sunday, 10 July 2016

Natural Gas @ the edge of break up

                               NG @ the edge of breakout ?

Channel Pattern

As seen in the attached hourly Ng chart , price is moving in a upward moving channel since last 3 days. It touched 2.80 @ the resistance line of the channel and come down fast to kiss support line placed @ 2.70. Again price move upward and touch the resistance line placed @ 2.84 on second time. After touching resistance line price moved down sharply towards support line , which is placed around 2.73. After that price moves in consolidation phase but give respect to support line. After consolidation on hourly chart, price starts moving upward and now placed @ 2.8117, resistance line is placed around 2.88 -- 2.90.

                                           Moving Average 

On dma front , we can see that 10 dma ( blue ) crossed 20 dma ( green ) upwards and running upwards to cross 100 dma ( red ). Seeing the steam in which 10 dma is moving upward, it looks very much possible that it will cross 100 dma in very little time and 20 dma line will follow the suit.Watching channel line and dma structure we can expect that price is heading towards resistance line which is placed @ 2.88 to 2.90. 

                                              Symmetrical Triangle   

There is one important pattern of symmetrical triangle is devloping in this channel. It is powerful pattern. After completing the triangle price should breakout in the direction of prior trend & the trend is upward. In my prior analysis on NG i wrote only on this symmetrical triangle and after that price of NG made huge jump on upward and touch 3 dolor price but this time triangle is small compare to previous one but capable of breaking resistance line of the ongoing channel. Looking at the consolidation happened , price can break the resistance line and move upward towards 3 dolor resistance , as the thumb rule of three attempts.

Conclusion - one can go long on cmp Rs 189 around ( mcx ) for the tgt of 200 + with the sl of 186.

Update of analysis, 12/7/2016 


As shown in the attached chart, price moved upwards to the channel resistance line after breaking Symmetrical triangle. Price touch the resistance line @ the point of 2.87 dolor and turn back towards support line. This down move was very fast and with this force it broke the support line and went down.
Hope you booked your profits before it cross our long entry price downwards. We have enough time to book profits as seen in this hourly charts.
Nothing to saay more about NG because change of technicals demolish the previous chart pattern. Keep visiting to read ongoing patterns on varoius commodities.
Wish you profitable trading, thank you.